Two companies with identical earnings sell for very different prices. One went to a strategic acquirer who could fold it into an existing platform; the other to a fund pricing it on standalone cash flow. Neither buyer overpaid by their own logic — they were pricing against different things. This is the benchmark for how acquisition prices actually get set: the premium a buyer pays over standalone value, why the type of buyer moves the number by turns of EBITDA, the size discount that quietly prices small companies below large ones, and who the buyers setting prices in the Gulf really are.
An honest note on the data
There is no GCC- or MENA-specific control-premium study. Every hard pricing number in this benchmark — control premiums, the strategic-versus-financial gap, the platform-versus-add-on multiple spread — is drawn from US and global data, because the standing control-premium datasets (FactSet/BVR, Mergerstat) cover publicly-traded targets only, and the GCC deal pool is overwhelmingly private with little price disclosure. What we can document regionally is who the buyers are and how that composition shapes pricing. We present the global benchmarks as the directional spine and the Gulf layer as a qualitative read, rather than invent a regional number no dataset supports.
The control premium: how much over standalone value
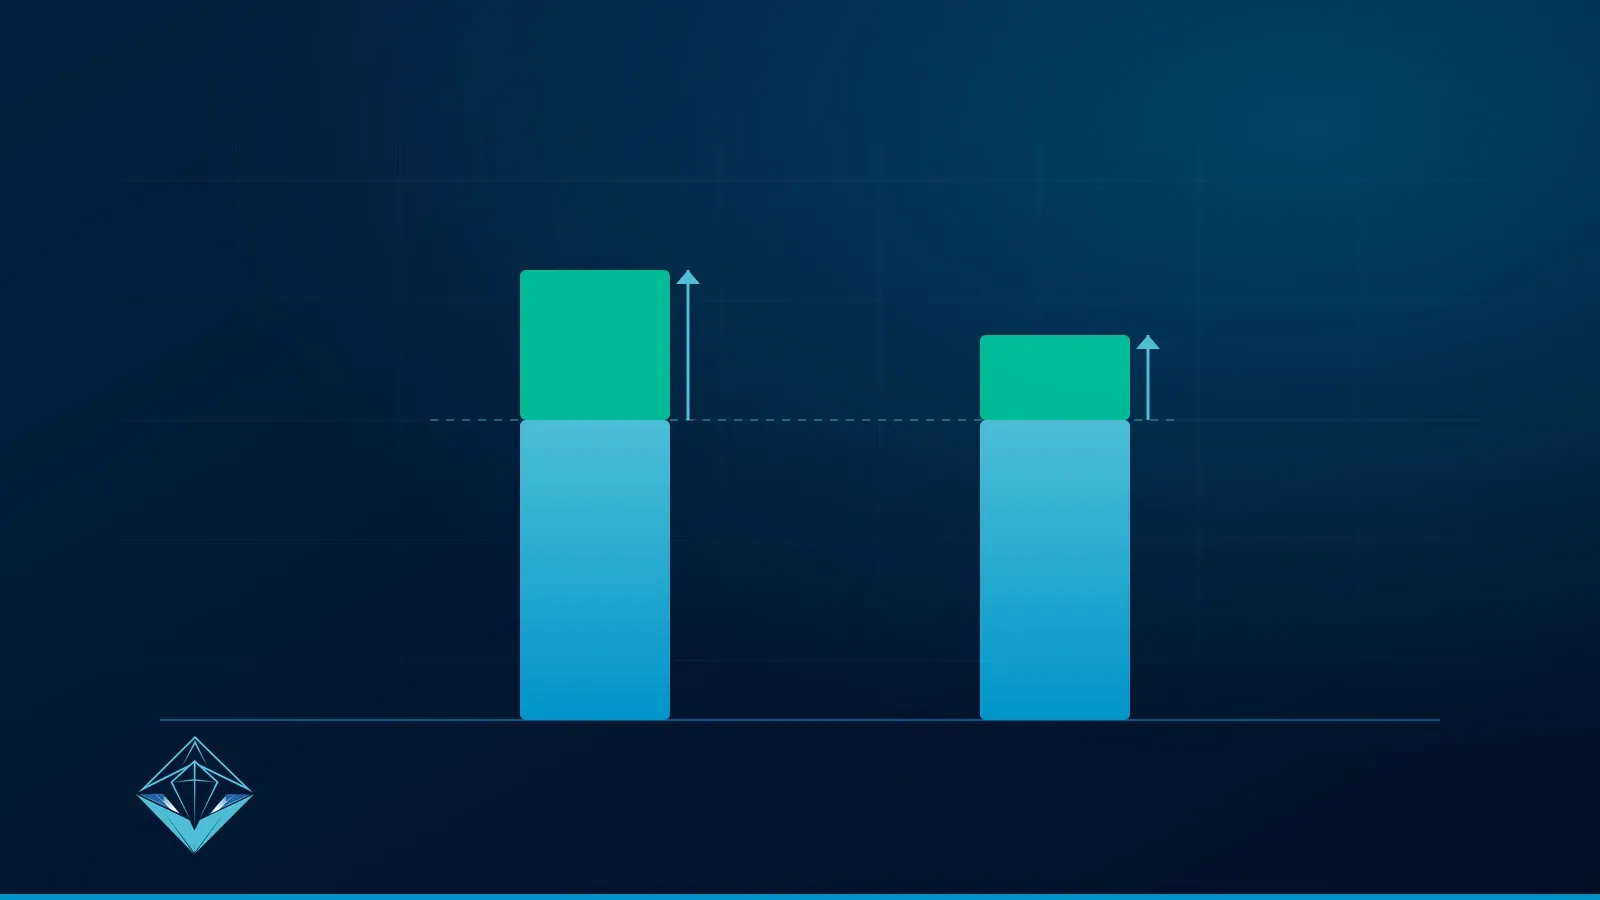
A control premium is what an acquirer pays above a target’s standalone (unaffected) value to take control. For public companies you can measure it against the pre-announcement share price: acquirers paid an average 37% premium over the 30-day price in Q1 2024, and about 27% over the one-day price — down modestly from 41% and 33% in 2023, against a five-year average of 39% / 30% (Canaccord Genuity, M&A Environment Report Q1 2024, data from Dealogic).
The honest caveat: those are premiums over a public trading price. A private company — the GCC and SME norm — has no observable pre-deal price, so the premium isn’t a measurable percentage; it’s implicit in the multiple. That’s why the practical question for a private seller isn’t “what’s the premium” but “what is my business worth to this specific buyer, and what makes them pay up.”
Strategic vs financial buyers: the price gap is real
Strategic (trade) buyers can pay more because they underwrite synergies and the economics of the combined business. Financial/PE buyers price standalone cash flow against a target return (typically a 20–25% IRR) and leverage capacity. Three independent academic datasets all point the same way:
- MIT (US, 2000–2008): strategic 46.4% vs financial 36.5% — a ~10-point gap.
- Rotterdam/RSM (US, 1997–2006): 54.4% vs 42.5% — ~12 points.
- Copenhagen Business School (Western Europe, 1997–2013): 28% vs 22% — ~6 points (all via Focus Investment Banking).
These study windows are over a decade old, so treat the direction as robust and the exact magnitude as variable by sector, size and competitive tension. A workable rule of thumb: strategics tend to pay roughly 6–12 percentage points more in premium — often cited as one to three turns of EBITDA — where genuine synergies exist. And most sellers are facing a strategic: financial sponsors were only about 17% of total transaction volume in Q1 2024 (down from a 24% five-year average), so synergy pricing is usually in play.
Platform vs add-on: the size-premium engine
The single most reliable pricing pattern in private M&A is the size premium — bigger companies trade at higher multiples than smaller ones — and it is the engine of buy-and-build. Large platforms ($100–500M of enterprise value) changed hands at about 9.8x trailing EBITDA in the first nine months of 2025, versus 7.0x for sub-$100M businesses — a 2.8-turn spread, against a 2.6-turn long-run average (GF Data, Q3 2025).
That gap is why add-ons dominate private equity: bolt-ons made up 72% of all North American buyouts in 2022 (Bain & Company), which describes them as “multiple arbitrage plays where a GP buys smaller companies at lower multiples to build them into a larger one that will command a higher valuation.” The mechanism: buy the platform at 9–10x, fold in smaller companies at 5–7x, and create value from the multiple gap before any operational gain. If you are the add-on, you will be priced off the small-company band — unless you can credibly become the platform. This is also where deal structure and the terms a buyer puts on the table start to matter as much as the headline.
Who the GCC buyer pool actually is
You can’t look up a Gulf control premium, but you can see who’s setting prices. MENA M&A hit a record 884 deals worth US$106.1bn in 2025, of which the GCC was 685 deals / US$102.1bn (EY MENA M&A Insights, FY2025) — a deep, scaling buyer market. Its defining feature: sovereign wealth funds and government-related entities (ADIA, Mubadala, PIF) are the dominant buyer class — GREs were 64% of outbound deal value in 2025, and GRE/SWF buyers put US$21bn across 54 deals in the first half of 2025 alone (EY, H1 2025).
And cross-border deals carried most of the value — 61% in 2025 — so regional sellers are increasingly priced by international corporates and global PE, not only local buyers (who’s buying Gulf companies, in detail). A wider, more varied buyer pool is the sell-side’s structural advantage: more bidders, more buyer types, more competitive tension on price.
What it means in the Gulf
You cannot price a GCC deal off “the regional premium” because no such number exists. Price is set by who the buyer is (strategic vs PE vs sovereign), how the target fits, your platform-versus-add-on position, and — above all — the competitive tension in the process. That is the entire point of buy-side acquisition support on one side of the table and a structured, buyer-mapped sale process on the other: not to guess a premium, but to engineer the conditions that move price. Before you anchor on any number, see what your sector’s earnings multiples actually look like in the GCC, and know the questions that separate a serious acquirer from a tyre-kicker. To pressure-test a number for your own business, run the free valuation calculator.
Sources
Control premiums + sponsor share: Canaccord Genuity, M&A Environment Report Q1 2024 (data: Dealogic) — public-target. Strategic vs financial: MIT, Rotterdam School of Management and Copenhagen Business School studies, via Focus Investment Banking (study windows 1997–2013). Add-ons + multiple arbitrage: Bain & Company, Global Private Equity Report 2023. Size premium: GF Data, Q3 2025 M&A Report. GCC buyer pool: EY MENA M&A Insights FY2025 and H1 2025. The standing control-premium datasets (FactSet/BVR, Mergerstat) cover public targets only; the largest private-deal study (SRS Acquiom, 2,200+ US private-target deals 2019–2024) is US-focused. No GCC-specific control-premium or private-deal pricing survey exists; US/global figures are the directional spine and are not presented as Gulf prevalence rates.
Frequently asked questions
How much do acquirers pay over a company's standalone value?
For public companies, where there is an observable share price to measure against, acquirers paid an average premium of about 37% over the target's 30-day pre-announcement price in early 2024 (roughly 27% over the one-day price). For a private company — the GCC and SME norm — there is no quoted price to take a premium over, so the 'premium' is buried inside the multiple a buyer agrees to pay. There is no published private-company or GCC control-premium figure; pricing is set deal by deal.
Do strategic buyers pay more than private-equity buyers?
Usually, yes — where real synergies exist. Three independent academic studies all point the same way: strategic (trade) buyers paid roughly 6 to 12 percentage points more in premium than financial/PE buyers for comparable targets, because a strategic underwrites the combined business while a fund prices standalone cash flow against a target return. As a rough rule of thumb that's often cited as one to three turns of EBITDA — but only when the strategic can actually realise the synergies.
Why are small companies acquired at lower multiples than large ones?
It's the size premium, and it's the engine of buy-and-build. US data shows large platforms ($100–500M of enterprise value) changing hands at about 9.8x EBITDA versus around 7.0x for sub-$100M businesses — close to a three-turn gap. Acquirers exploit it: buy a platform at 9–10x, bolt on smaller companies at 5–7x, and the blended group is worth the higher multiple. If you're the bolt-on, expect to be priced off the small-company band, not the headline platform multiple.
Is there GCC-specific acquisition-pricing data?
No. The standing control-premium datasets (FactSet/BVR, Mergerstat) cover publicly-traded targets only and are dominated by US deals, and the largest private-deal study is US-focused — there is no Gulf equivalent because regional deals are overwhelmingly private with thin price disclosure. What is well-documented regionally is who the buyers are: corporates, regional private equity, and sovereign funds like ADIA, Mubadala and PIF. We use the global numbers as the directional spine and read the Gulf qualitatively.